Euclid has been surveying the sky since 14 February 2024 and data processing is in full swing – the first public release of 53 deg² of science-grade Wide Survey data will take place in March next year. But how much data has Euclid already observed and how can we possibly visualize this? At a rate of 10 deg² per day, the Euclid Wide Survey has already surpassed 1000 deg², that is 5000x the apparent size of the Moon in the sky! Now ESA has put out a first set of images that allow to grasp how much data Euclid is and will be producing.
208 gigapixels, from 260 observations covering 132 deg² of the southern sky – taking during only two weeks March and April 2024. This mosaic is big, but accounts for only 1% of the total Wide Survey area that Euclid will observe during its six year survey.
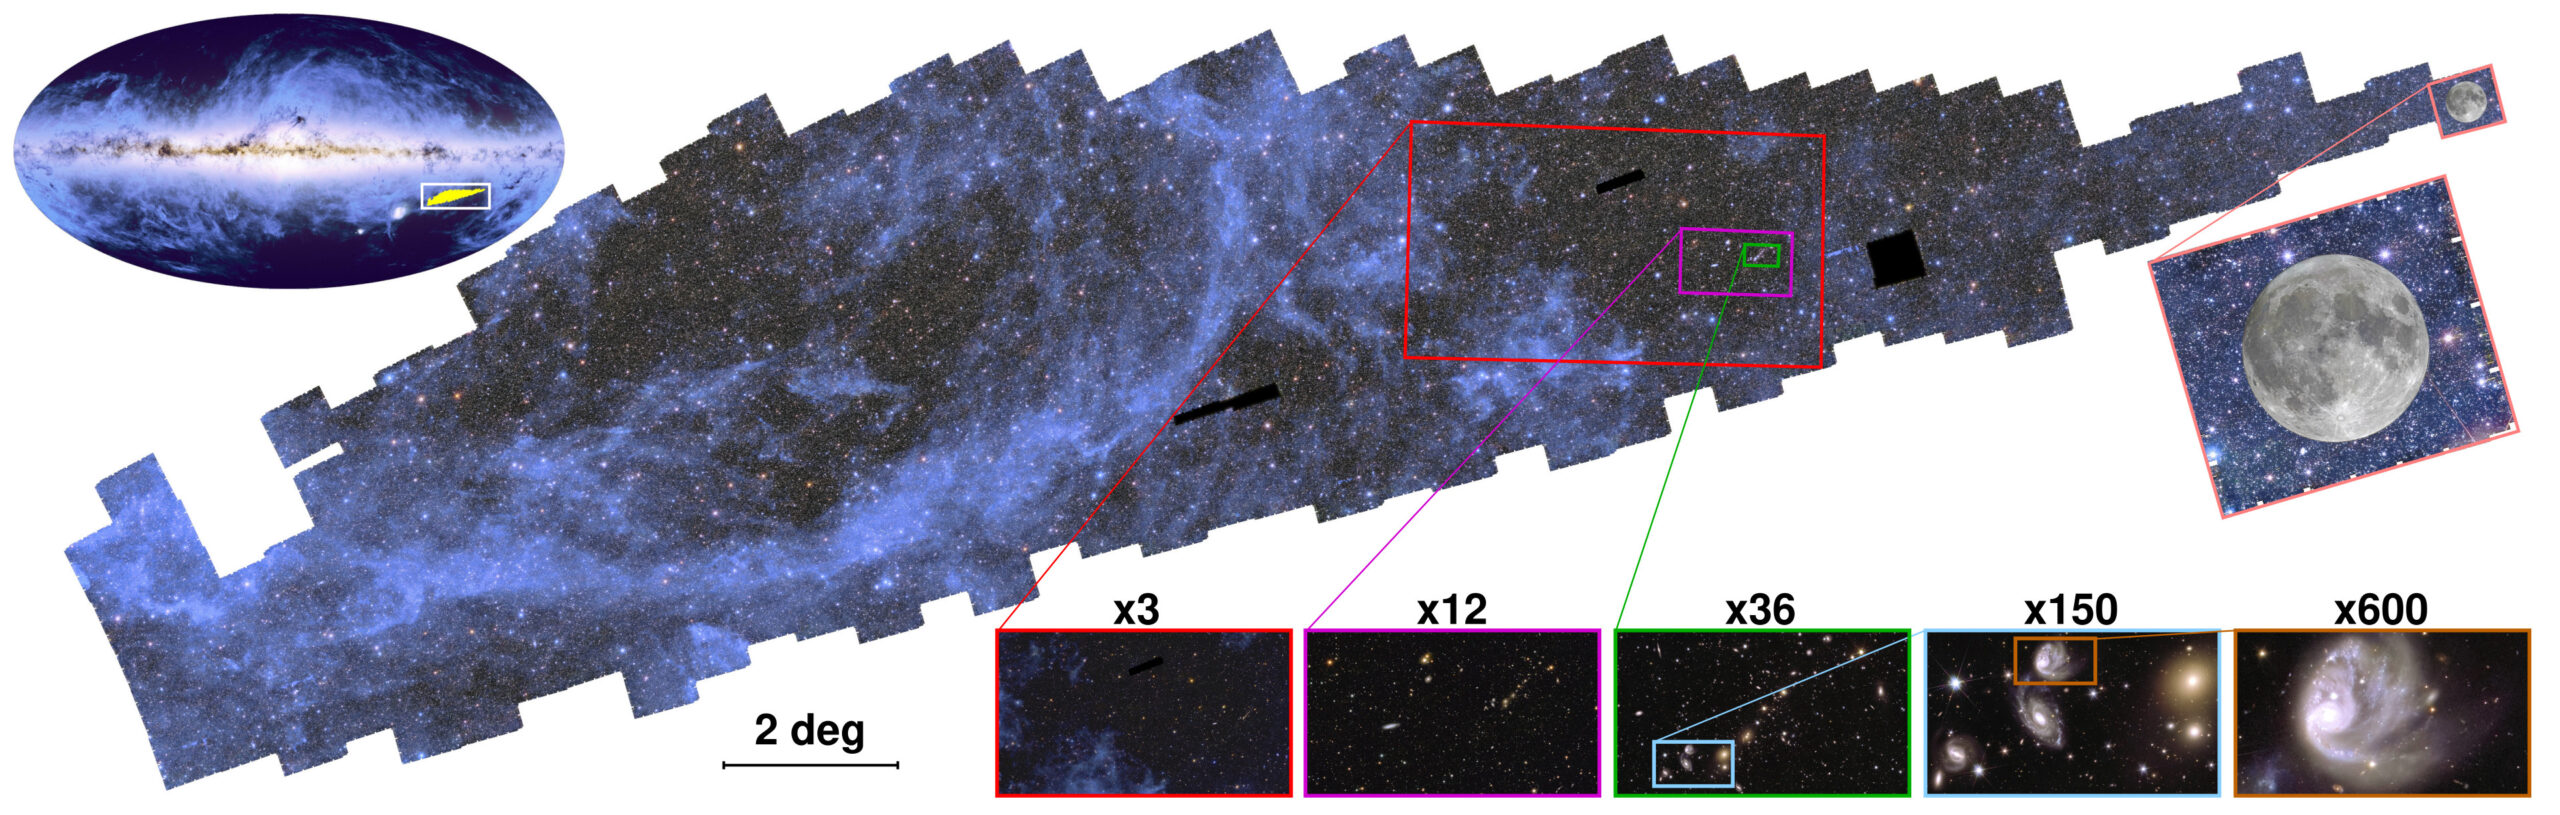
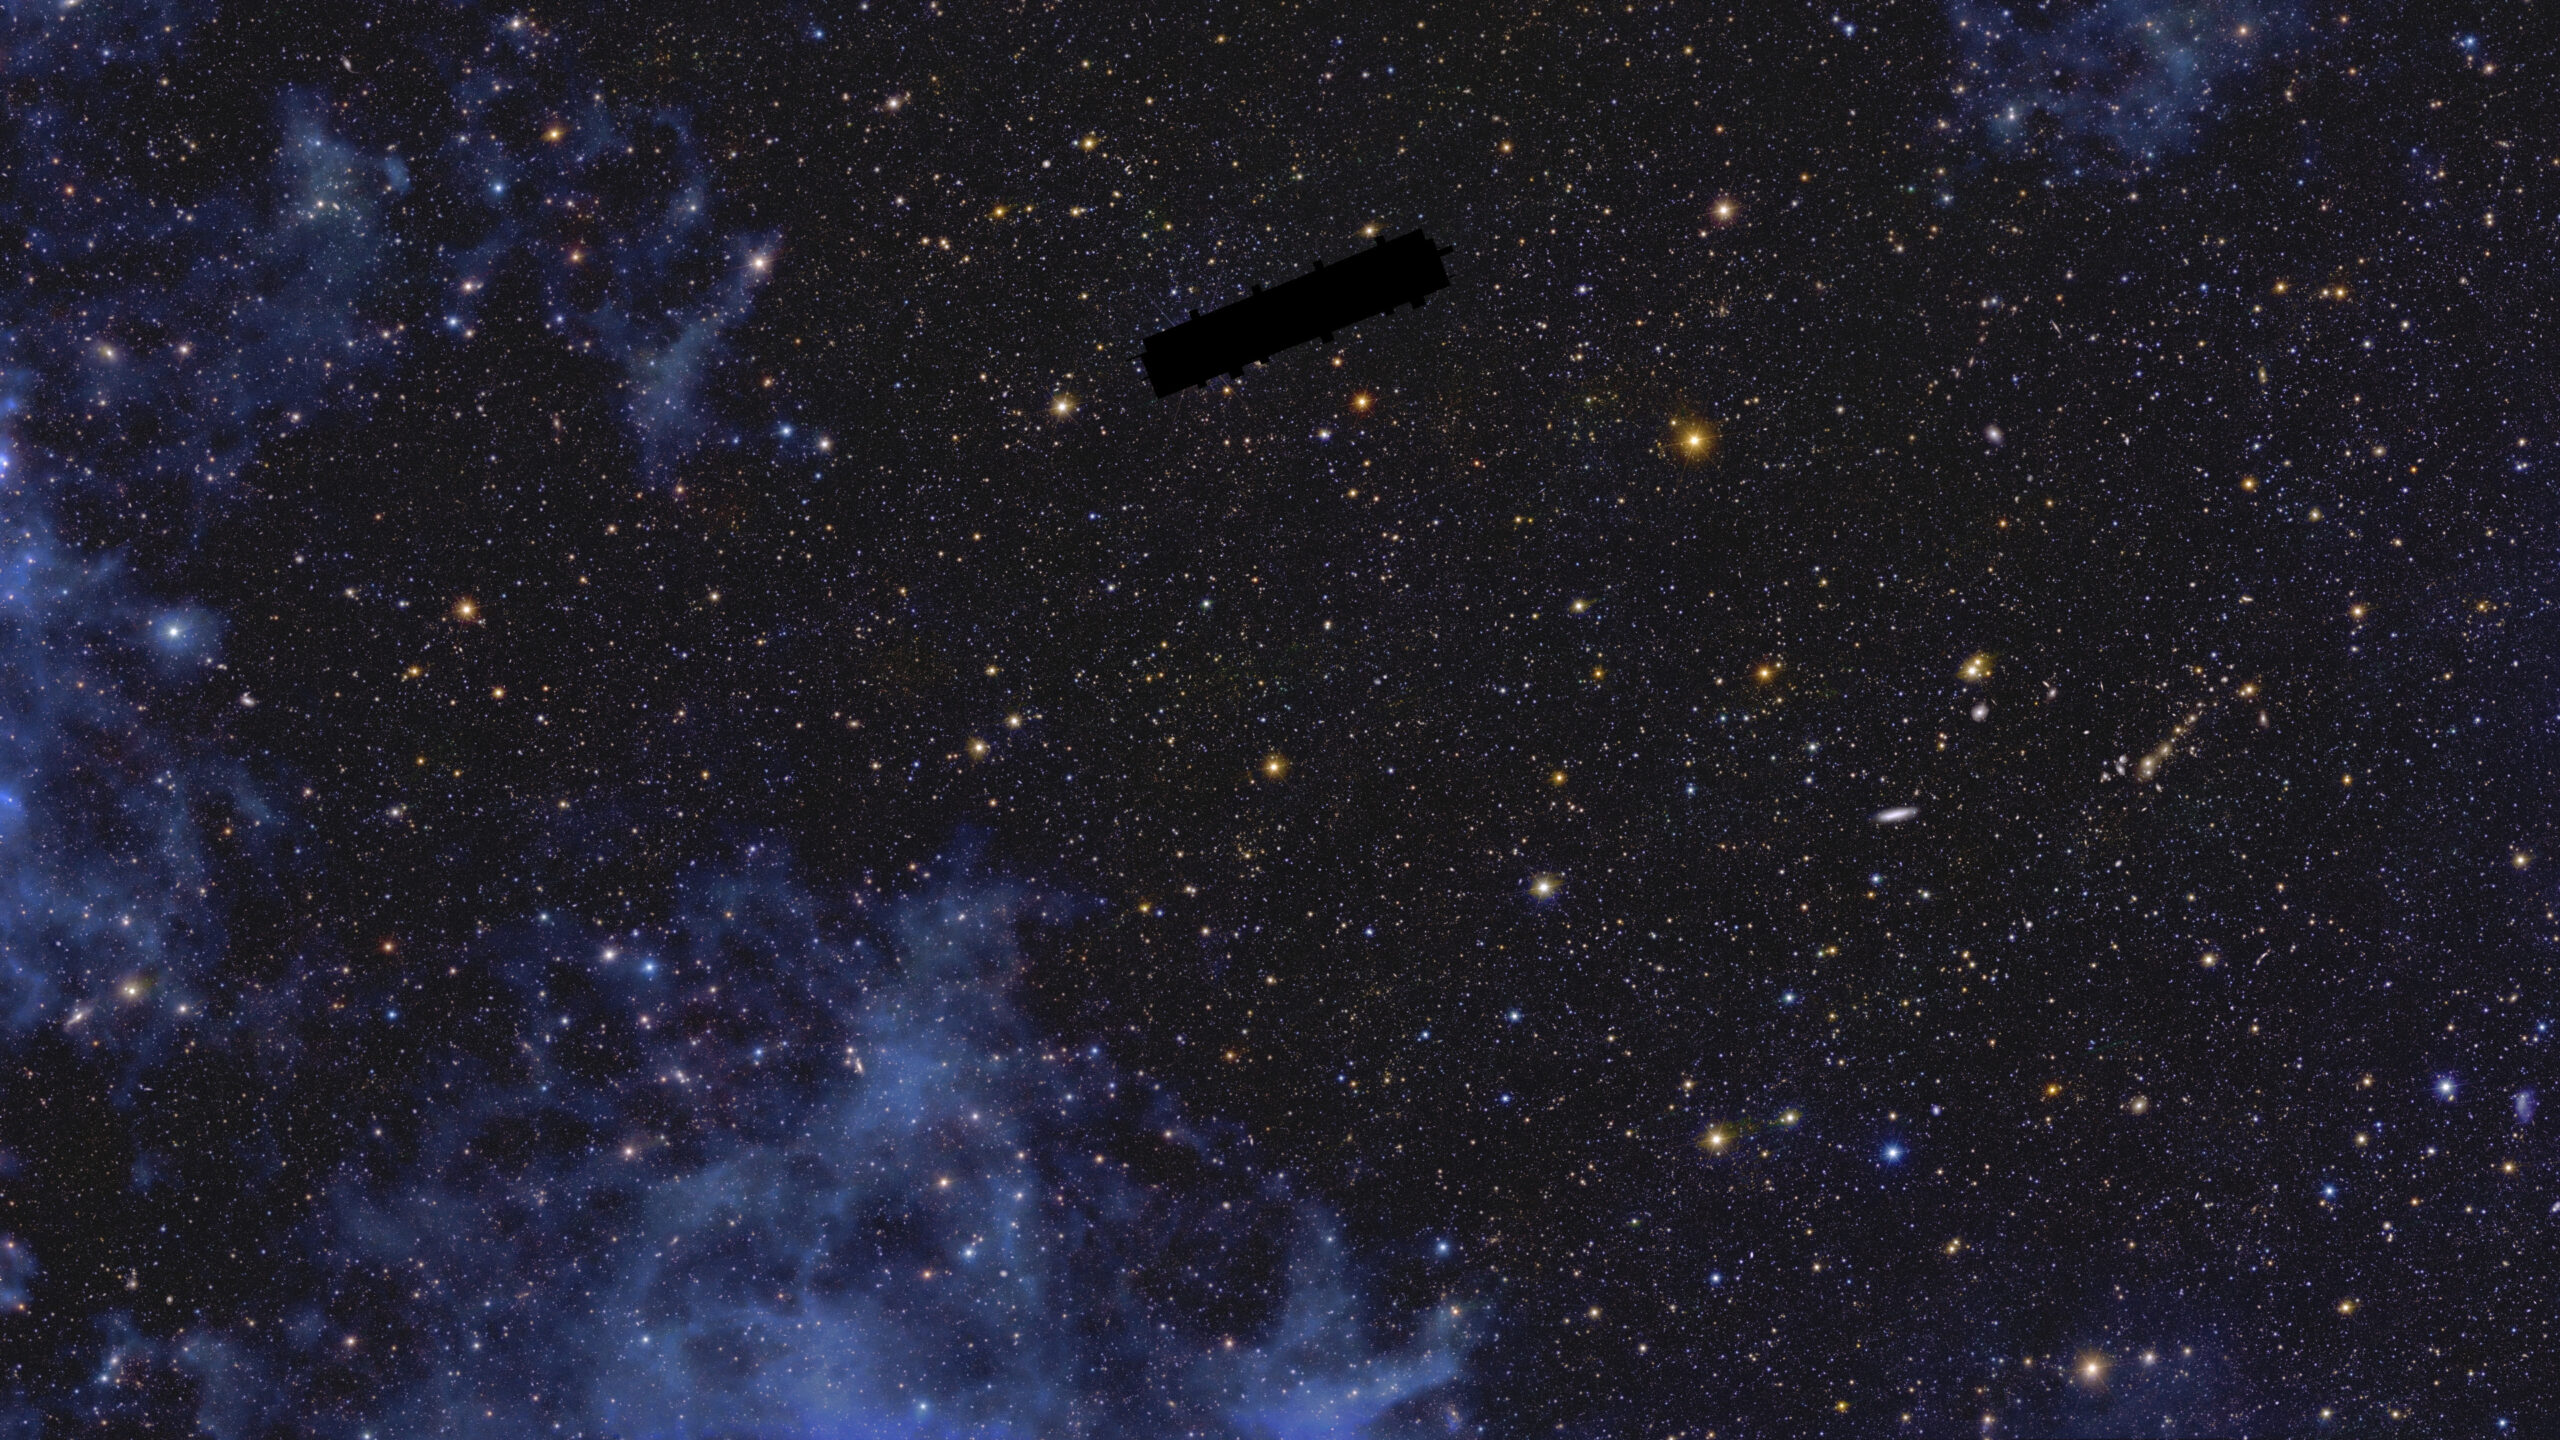
What can we see in this image mosaic? On large scales what first catches the eye are the blue-ish “clouds”. These are actually very thin gas and dust clouds, called “galactic cirrus” inside our Milky Way that reflect light from stars in our galaxy. They can be directly matched to the dust map created by ESA’s Planck mission a few years ago that is shown in the top left.
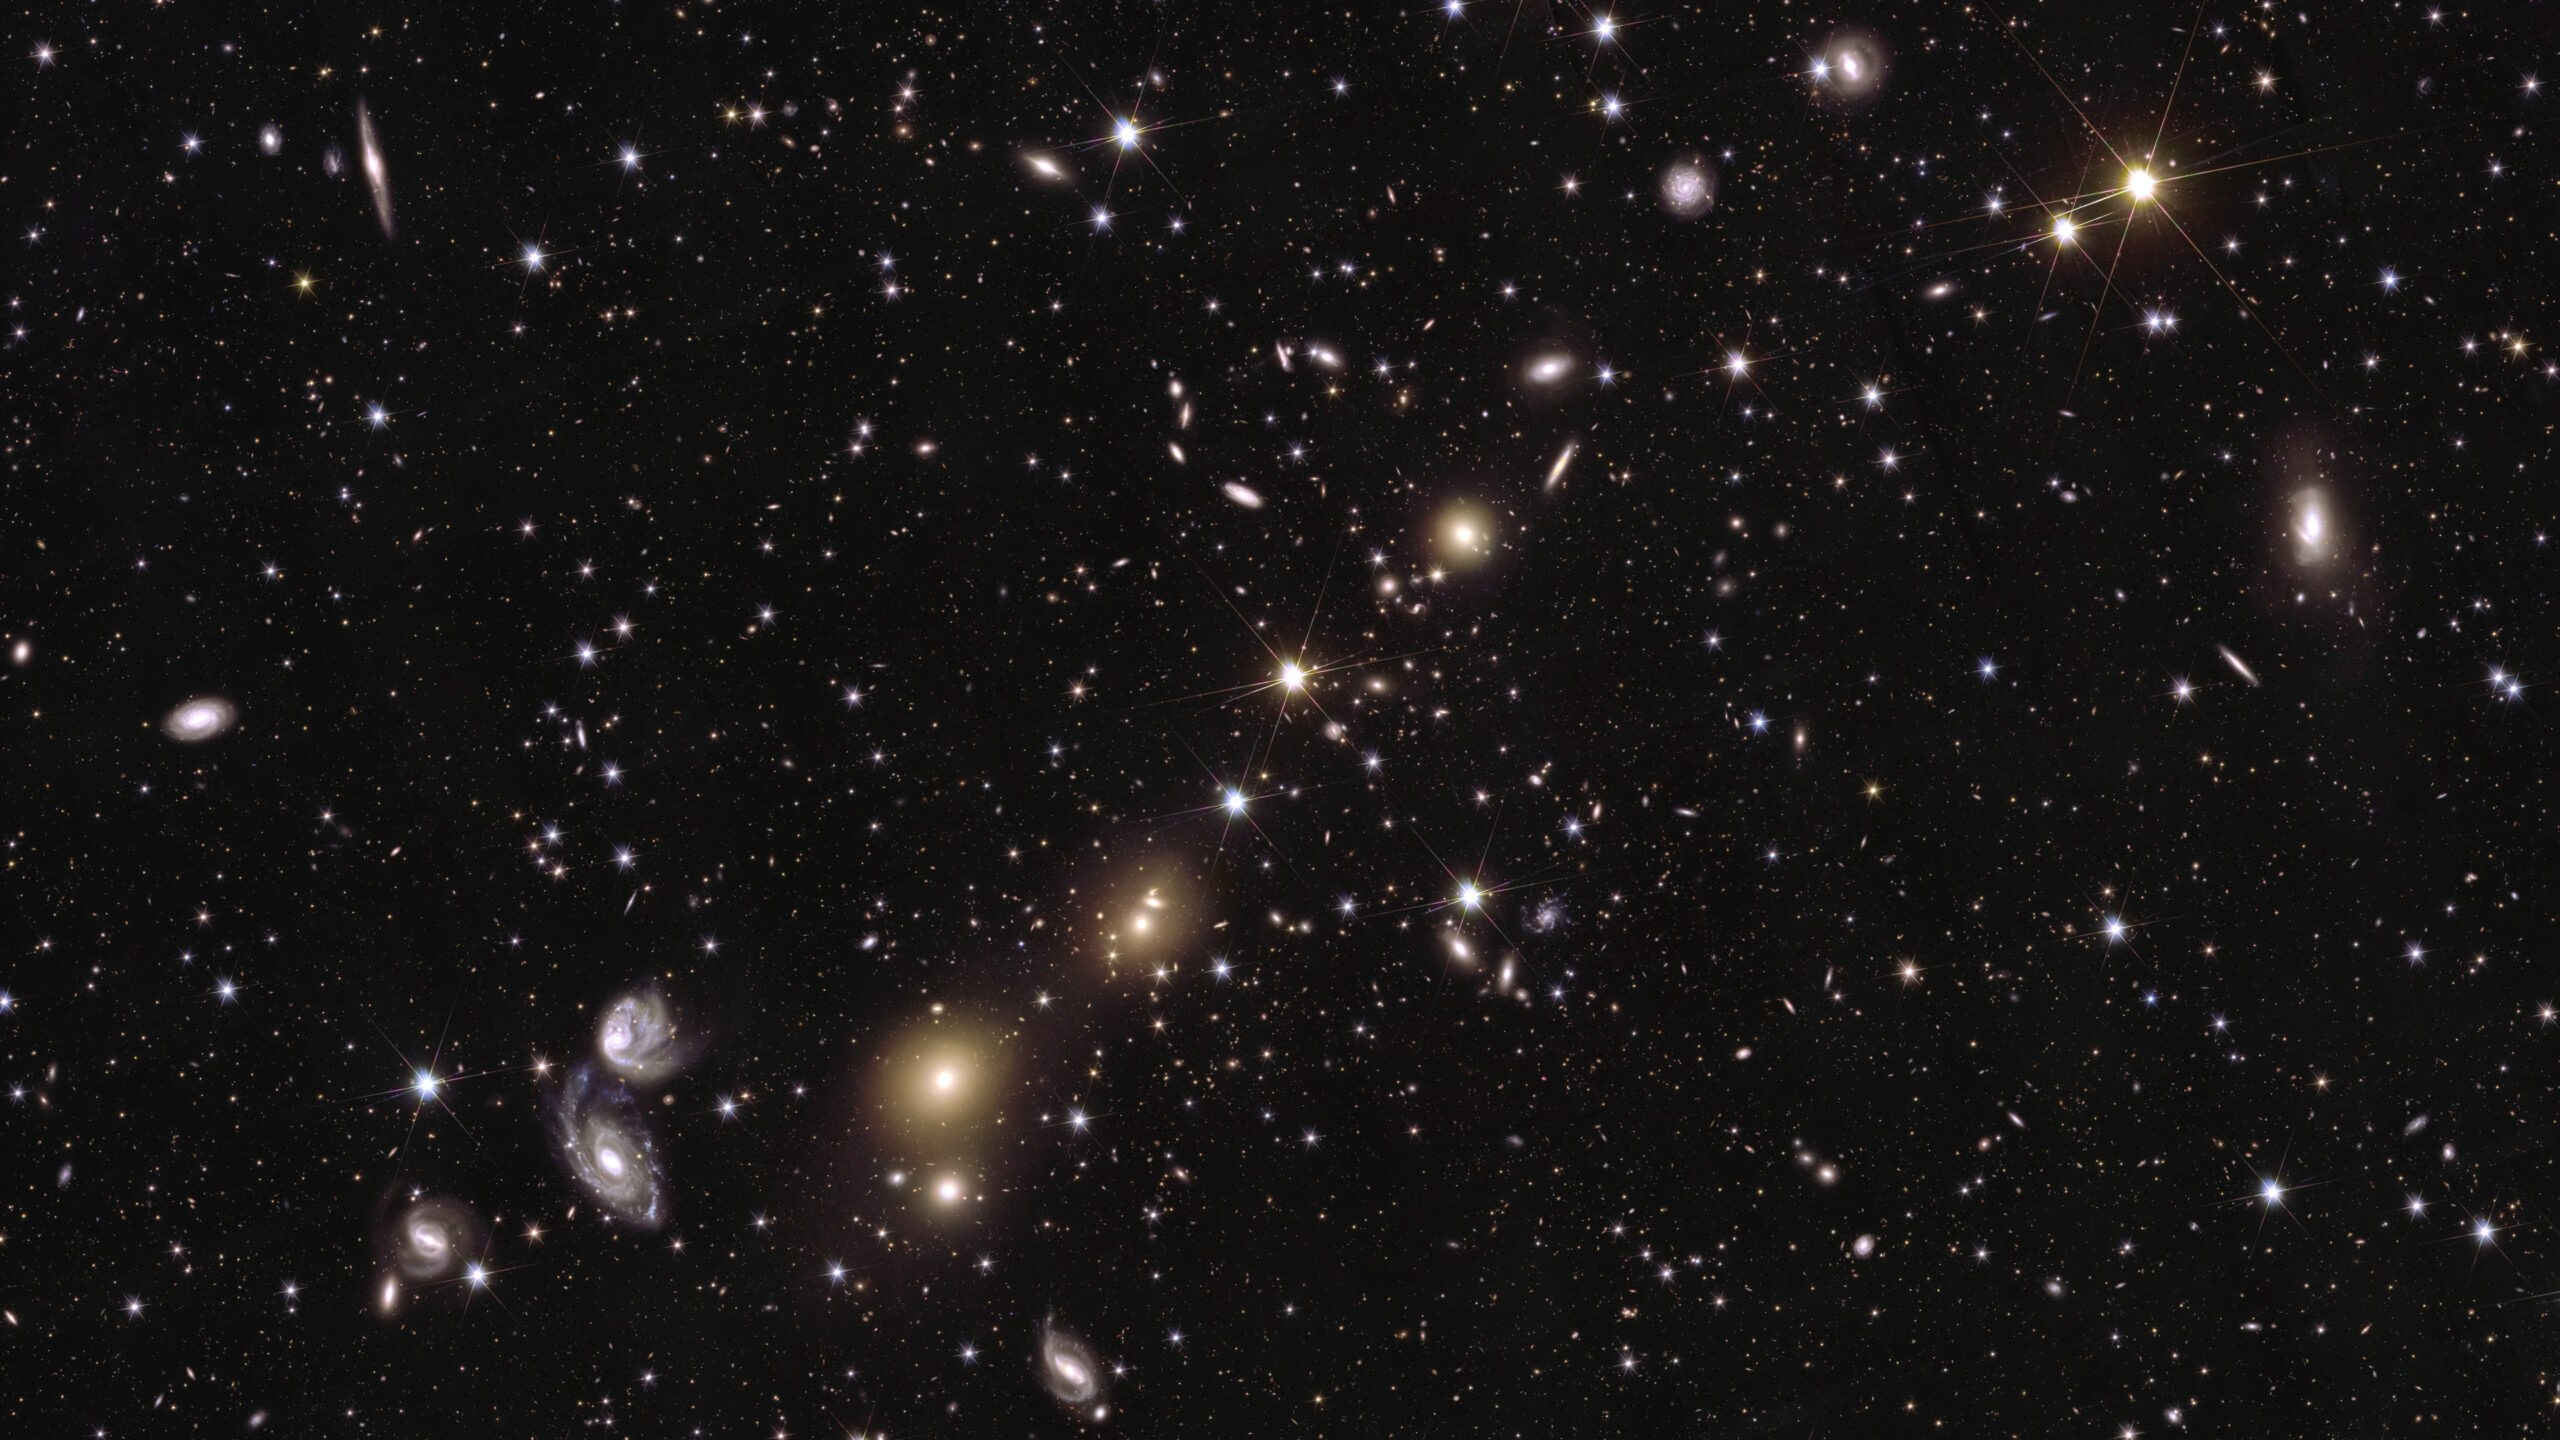
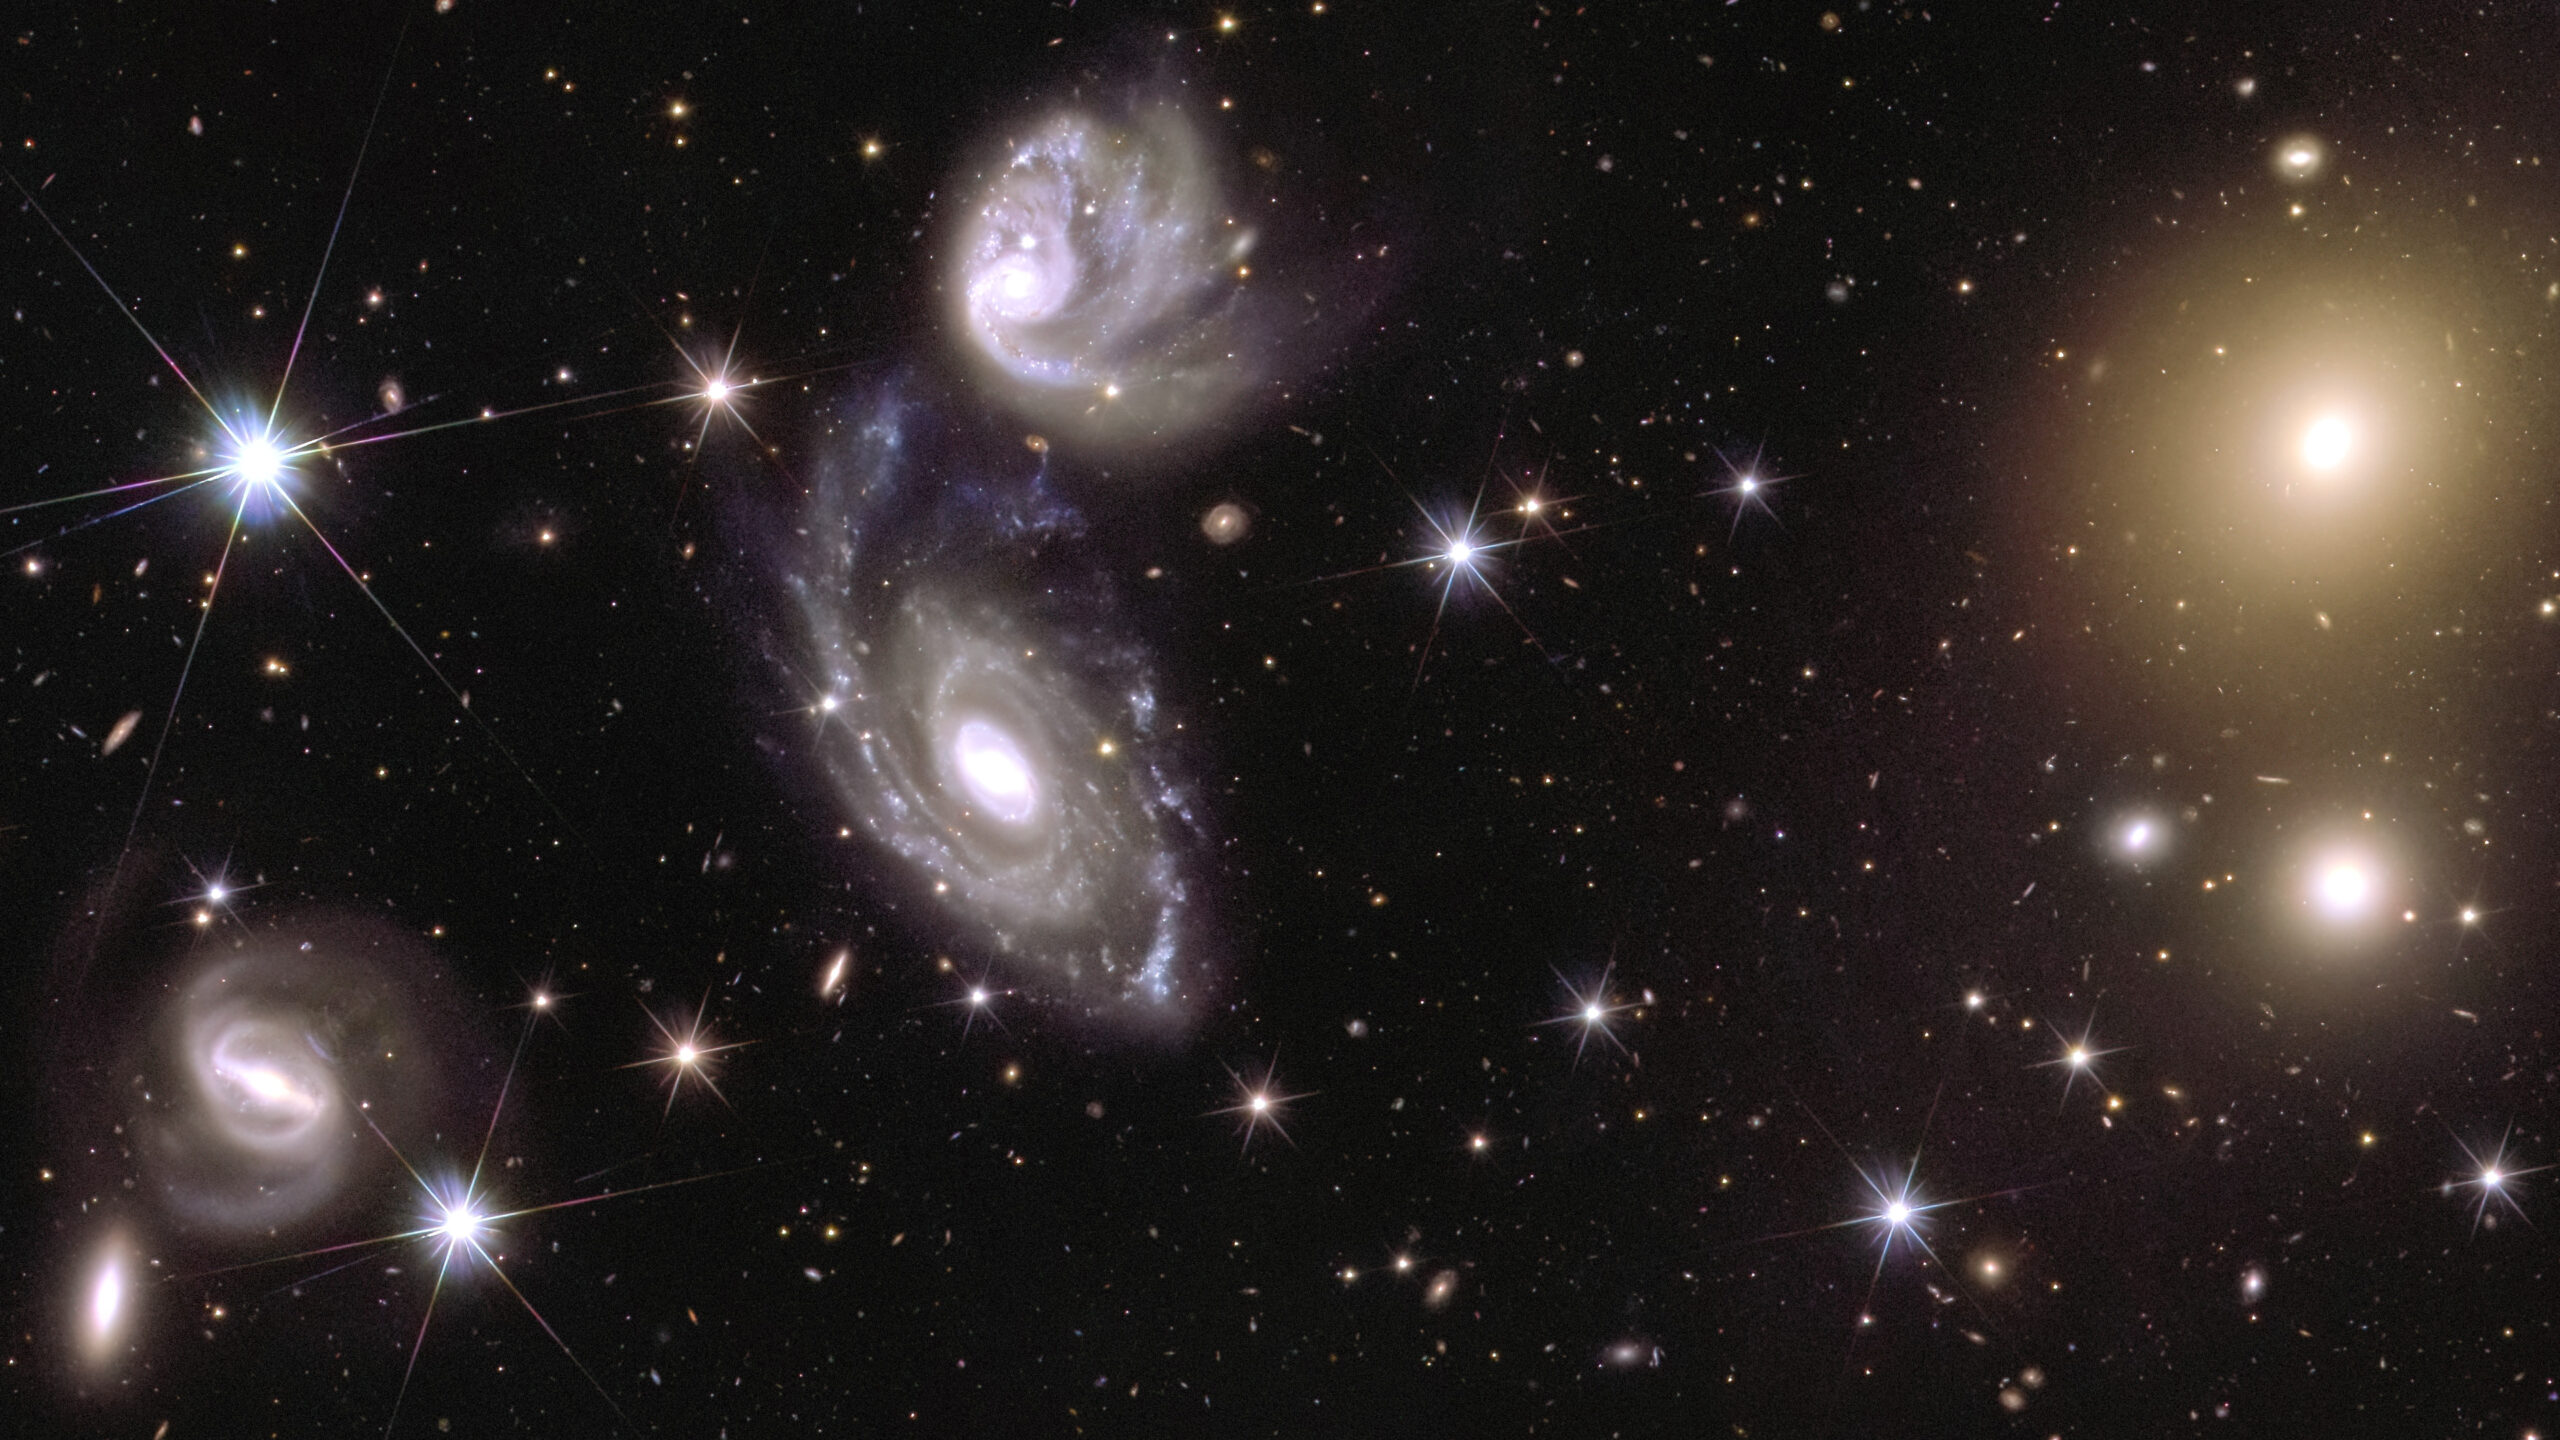
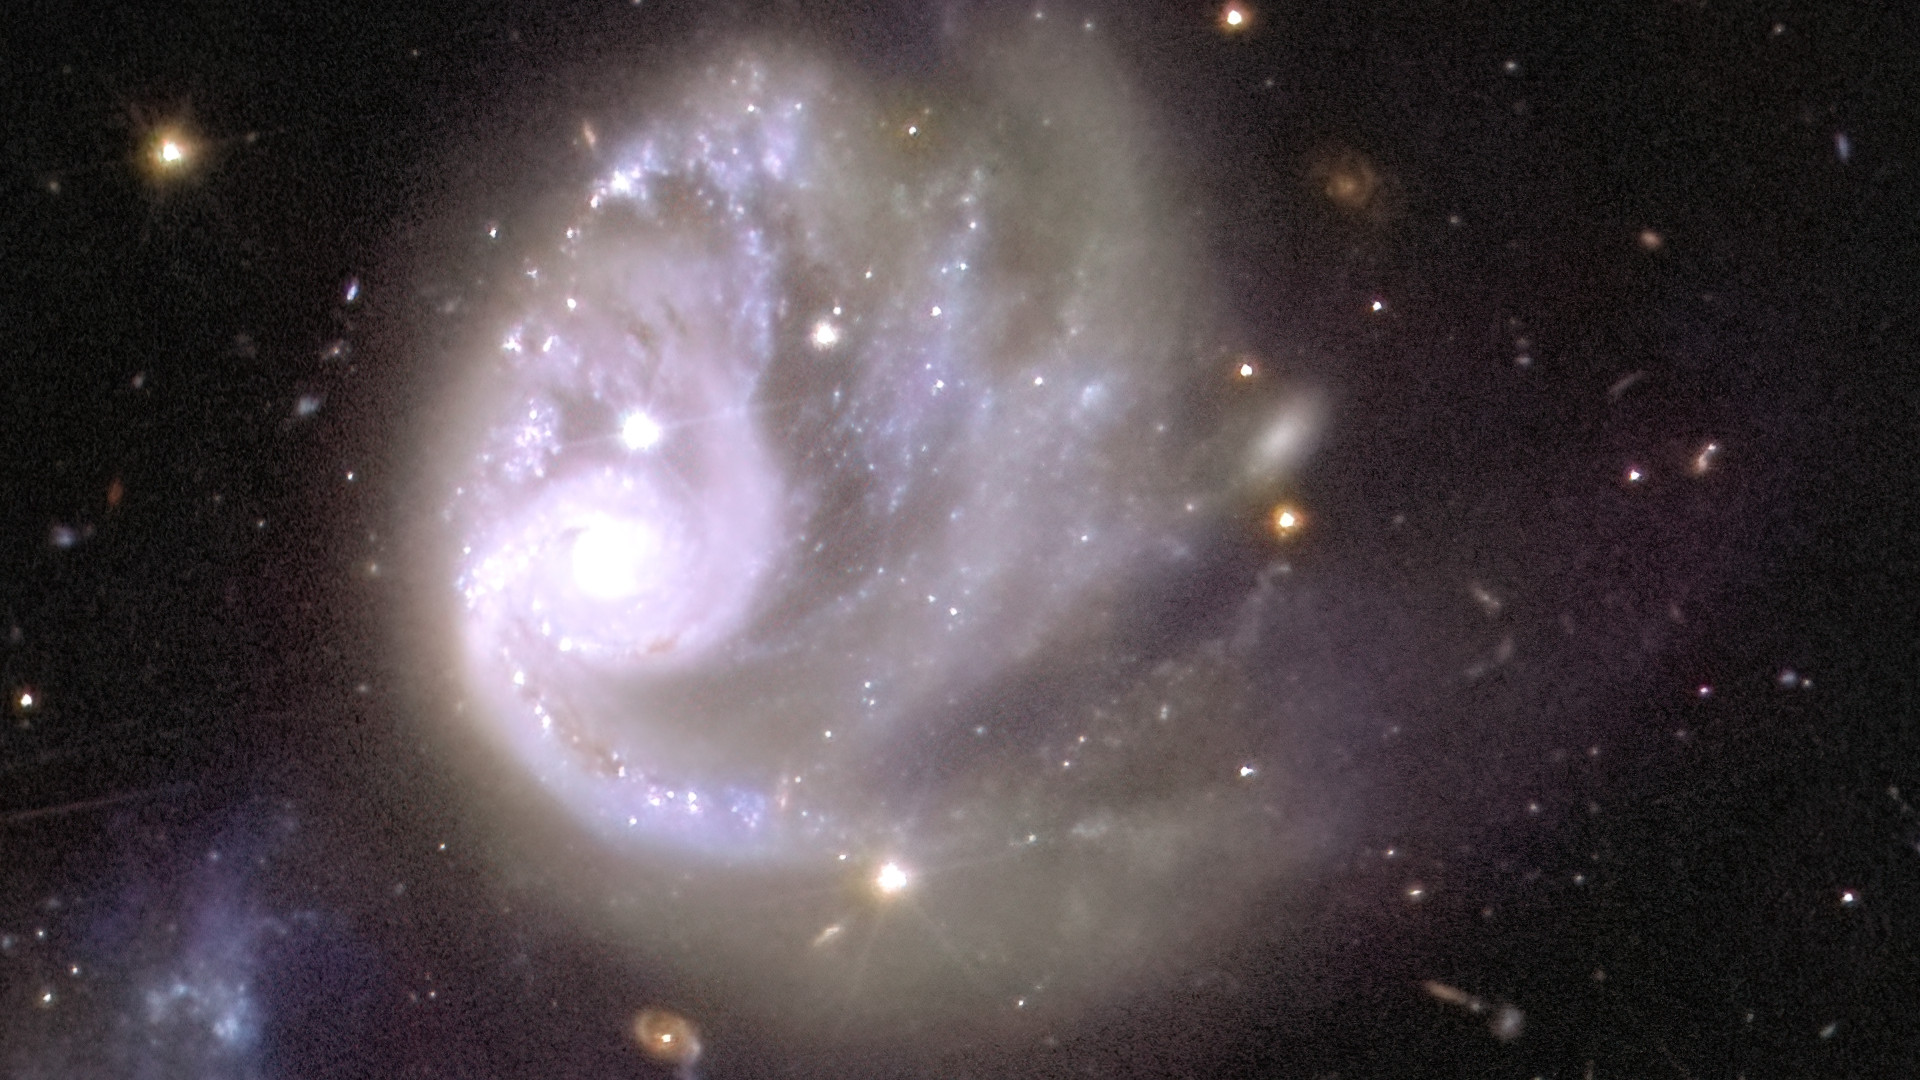
If one would look in very fine detail at higher and higher resolution – which is shown for a zoom-in area – one would be able to see and investigate around 14 million individual galaxies. All of these will be used in Euclid’s cosmology mission to map dark matter and cosmic structure across the epochs.
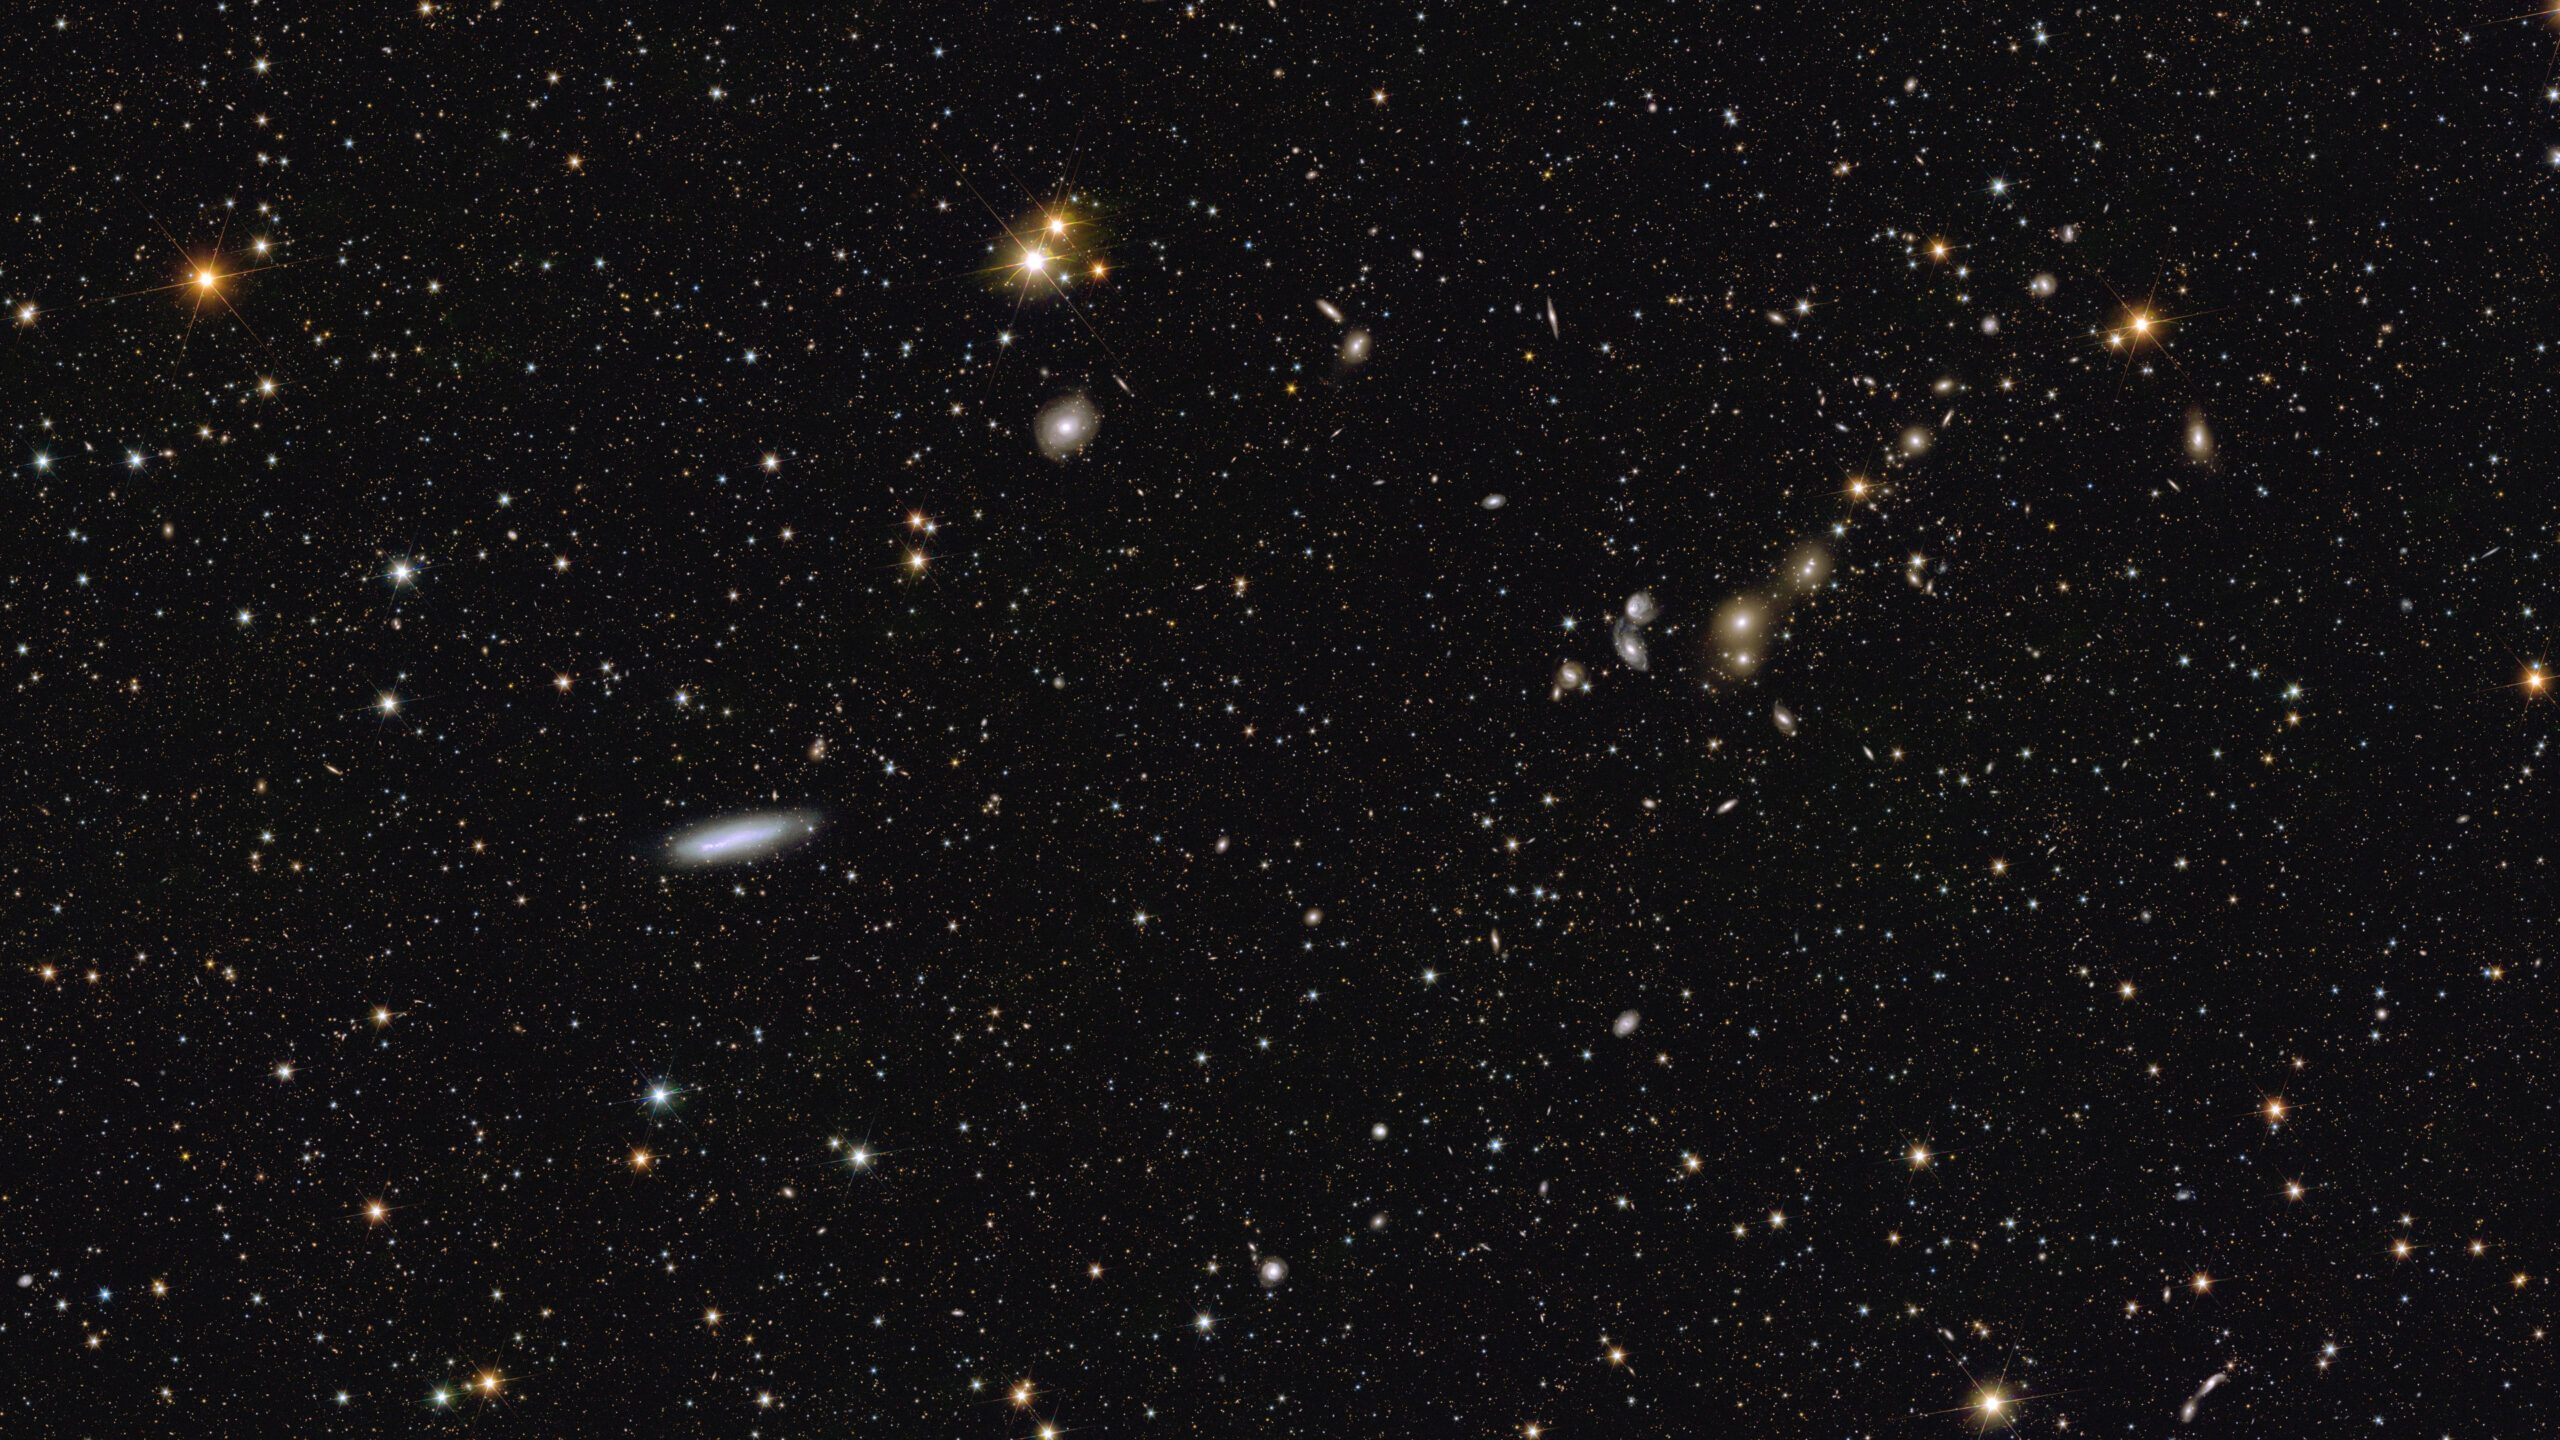
A further zoom into the image shows also larger galaxies – here we start seeing Abell 3381, a galaxy cluster 678 million light years away. All larger galaxies in the Euclid surveys will be subjects to investigate galaxy evolution across cosmic time, or to search for rare objects like supermassive black holes in the earlies times of the cosmos.
Euclid data allows to both cover very wide areas on the sky at the same time as capturing amazing, finely resolved details. After six years of surveying, Euclid will have observed one third of the whole sky, capturing more than 2 billion galaxies, both in the visible and near-infrared light.
These images are being publicly unveiled on 15 October 2024 at the International Astronautical Congress in Milan, Italy. The full release can soon be found at ESA’s Euclid pages, incl. full-res TIFF images, background info, and much more detailed explanations.